

The conceptual model is finished, and from here on it gets built. The shortest implementation route from source to finished report is the one that skips a whole layer of the architecture, and it works, too — for as long as the assumptions behind it hold.
At FastChangeCo, Terence Tindle, BI architect, wants to start right now. FastChangeCo is the fictional company I use to make real situations from projects and coaching sessions tangible.
Part 1 was about a meaning that existed and went missing on the way to the column, part 2 about one that nobody had ever decided. At FastChangeCo it is decided now: what an employee is has been settled, so have the subtypes, and each one has an owner. That brings up the method question. It is neither a matter of taste nor a religious war. It depends on the layer of the data warehouse architecture you pick a method for, and on the consequences — good and bad — that choice has two years out.
There is no best method, there are layers
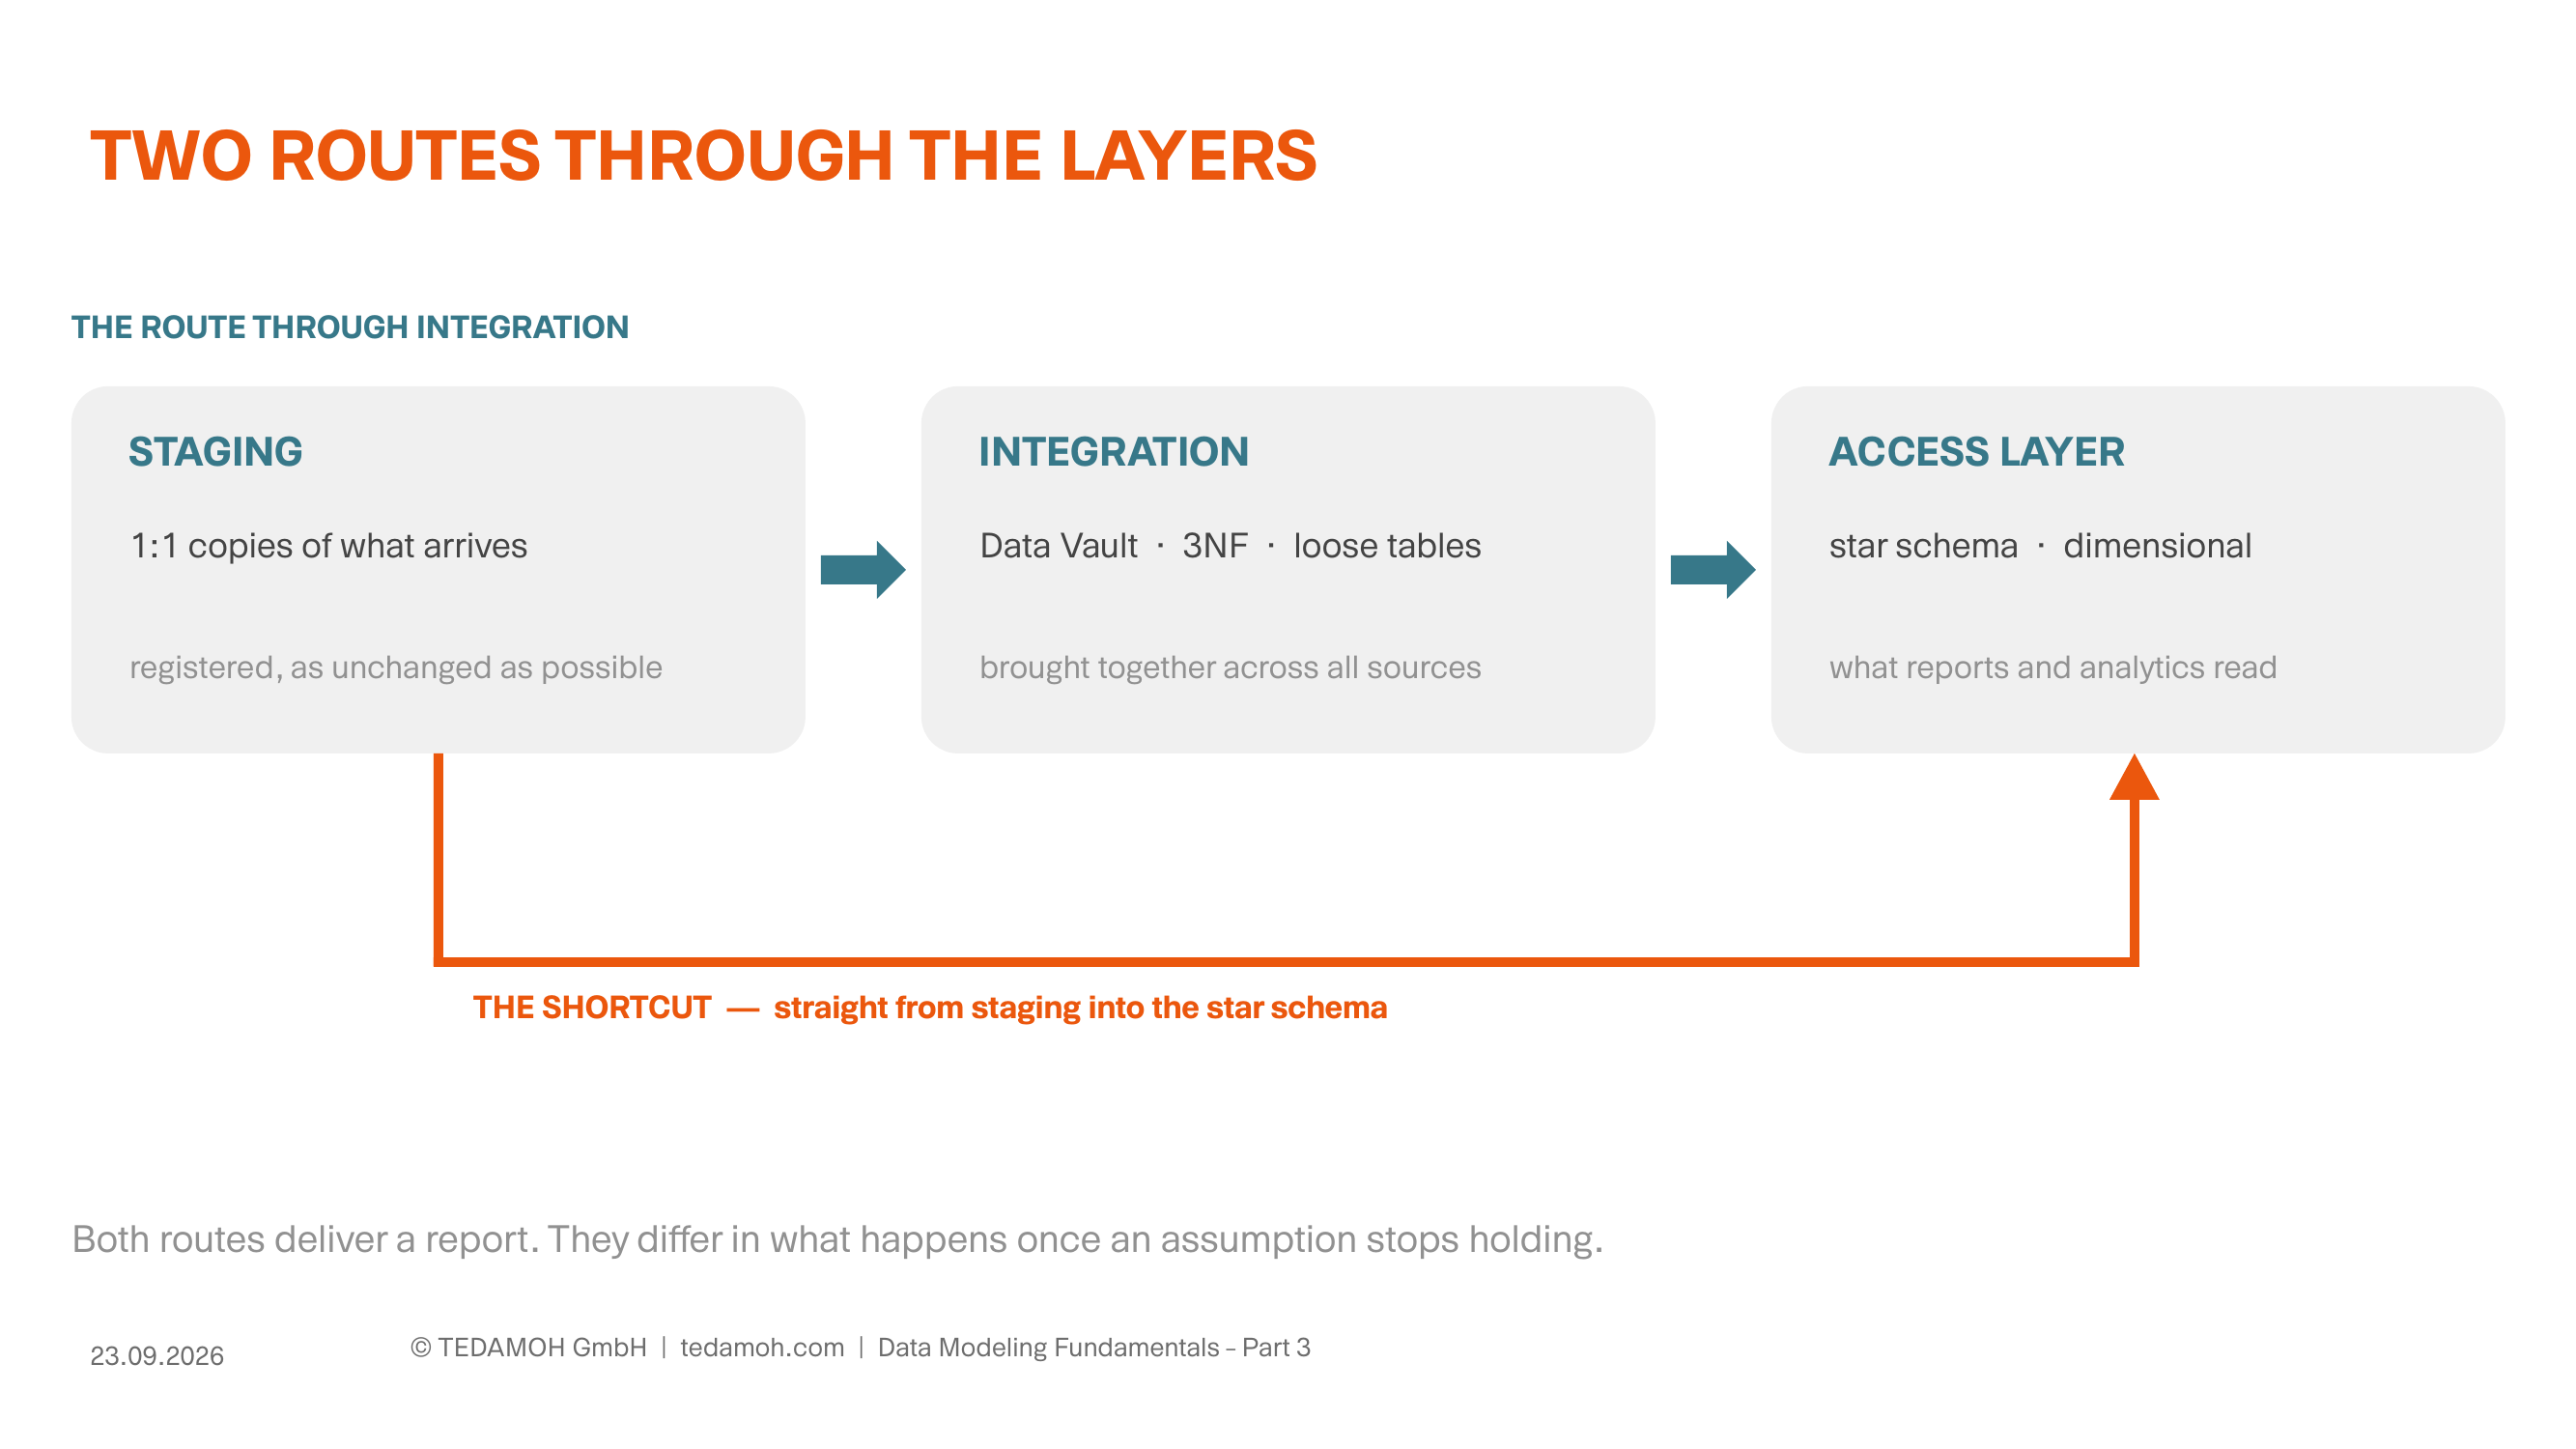
Two routes from source to report. One runs through the integration layer, the other goes past it.
Amal brings the conceptual model into the meeting. Terence thinks star schema right away, because that is what he needs for the dashboard. Jeff Jones from IT pushes back: 3NF is in the house, everyone can work with it. The two talk past each other. Their methods are not competing at all, they belong in different layers.
Bill Reynolds, Chief Data Architect, has a picture for this that I am happy to borrow. With "Big Data", he says, data modeling was driven out into the wilderness — structure is optional, the tools will figure it out — and out there the tribes of 3NF, dimensional, graph and Data Vault modelers wandered for twenty years until they gradually found each other again. His point is that modeling is gaining weight again right now: lakehouses, data products and AI pipelines do not replace it, they amplify it. What counts here is the middle of that story: not which tribe is right, but which layer is up.
A data solution has three of those, roughly, and the data runs through them left to right. On the far left sits staging, which registers what comes in from the source systems, as unchanged as possible. Behind it the integration layer, where things are brought together and enriched across all sources. And on the right the access layer — what reports and analytics read from.
Three methods are up for the job, and each has its layer. 3NF (third normal form) takes redundancy out of a model, so every statement is stored exactly once. Data Vault splits a model into business keys, relationships and descriptive attributes; it historizes by design and can largely be generated — what one of those looks like up close is in the coaching guide on links and satellites (in German). And dimensional modeling arranges measures and their analysis dimensions so a report has little work left to do; the star schema is its best-known form, not the same thing.
What has worked in my projects is usually the same combination: Data Vault in integration, star schema in the access layer. That is no law of nature; you can deviate any time. A deviation just needs a reason, and the reason belongs in writing. At its core, that is the whole decision tree.
The shortcut and the bill that follows
Jeff takes it one step further. The HR data arrives cleanly, the schema has been the same for years, and nobody has ever asked for an audit trail. So why an integration layer at all? You could load from staging straight into the star schema — faster, no question.
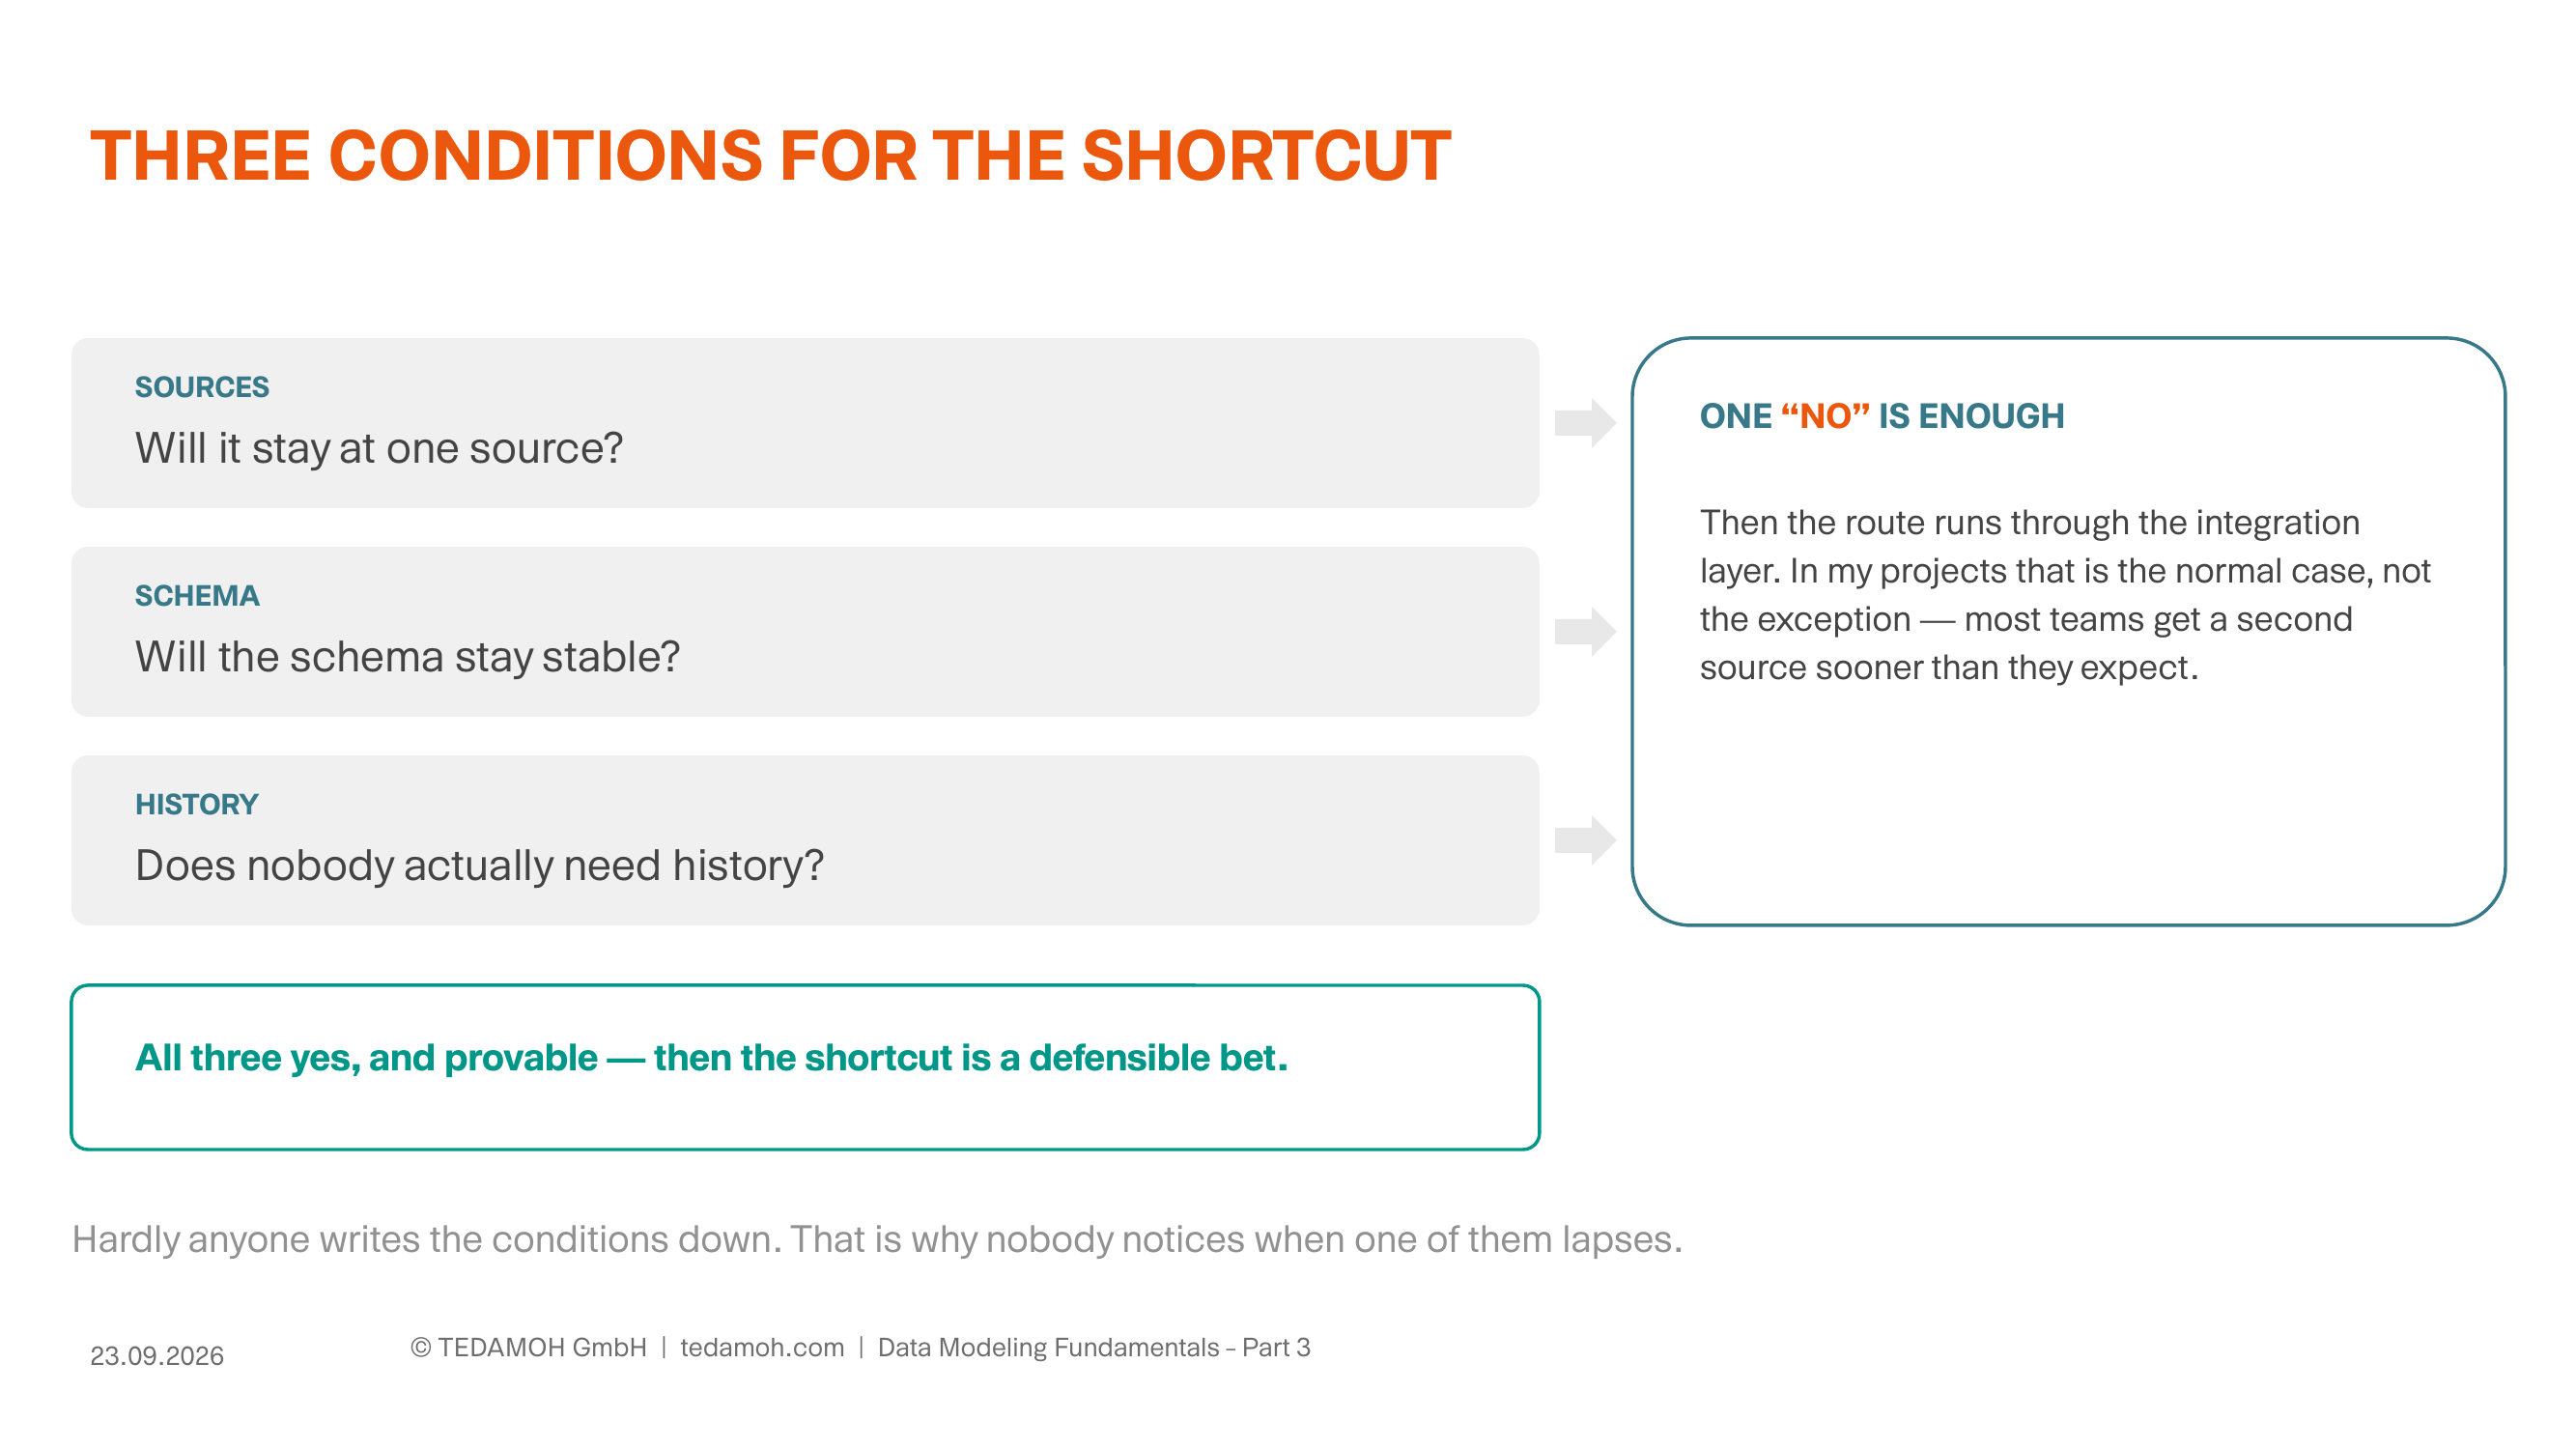
Three conditions, and only if all three hold does the path run past the integration layer.
That shortcut is a bet at heart, and it comes with conditions. Will it stay at one source? Will the schema stay stable? Does nobody actually need history? If you can answer all three with yes and back those answers up, take the shortcut.
Lose one of them and the bill arrives. A second source shows up, and the integration has to happen somewhere — inside the star schema itself, or in a second one next to it with its own dimensions. From then on you explain why two reports show different numbers. Ask for history later and it gets built by hand as slowly changing dimensions (SCD type 2), one at a time. And when the source system changes its schema, with no layer in between that change travels into the reports.
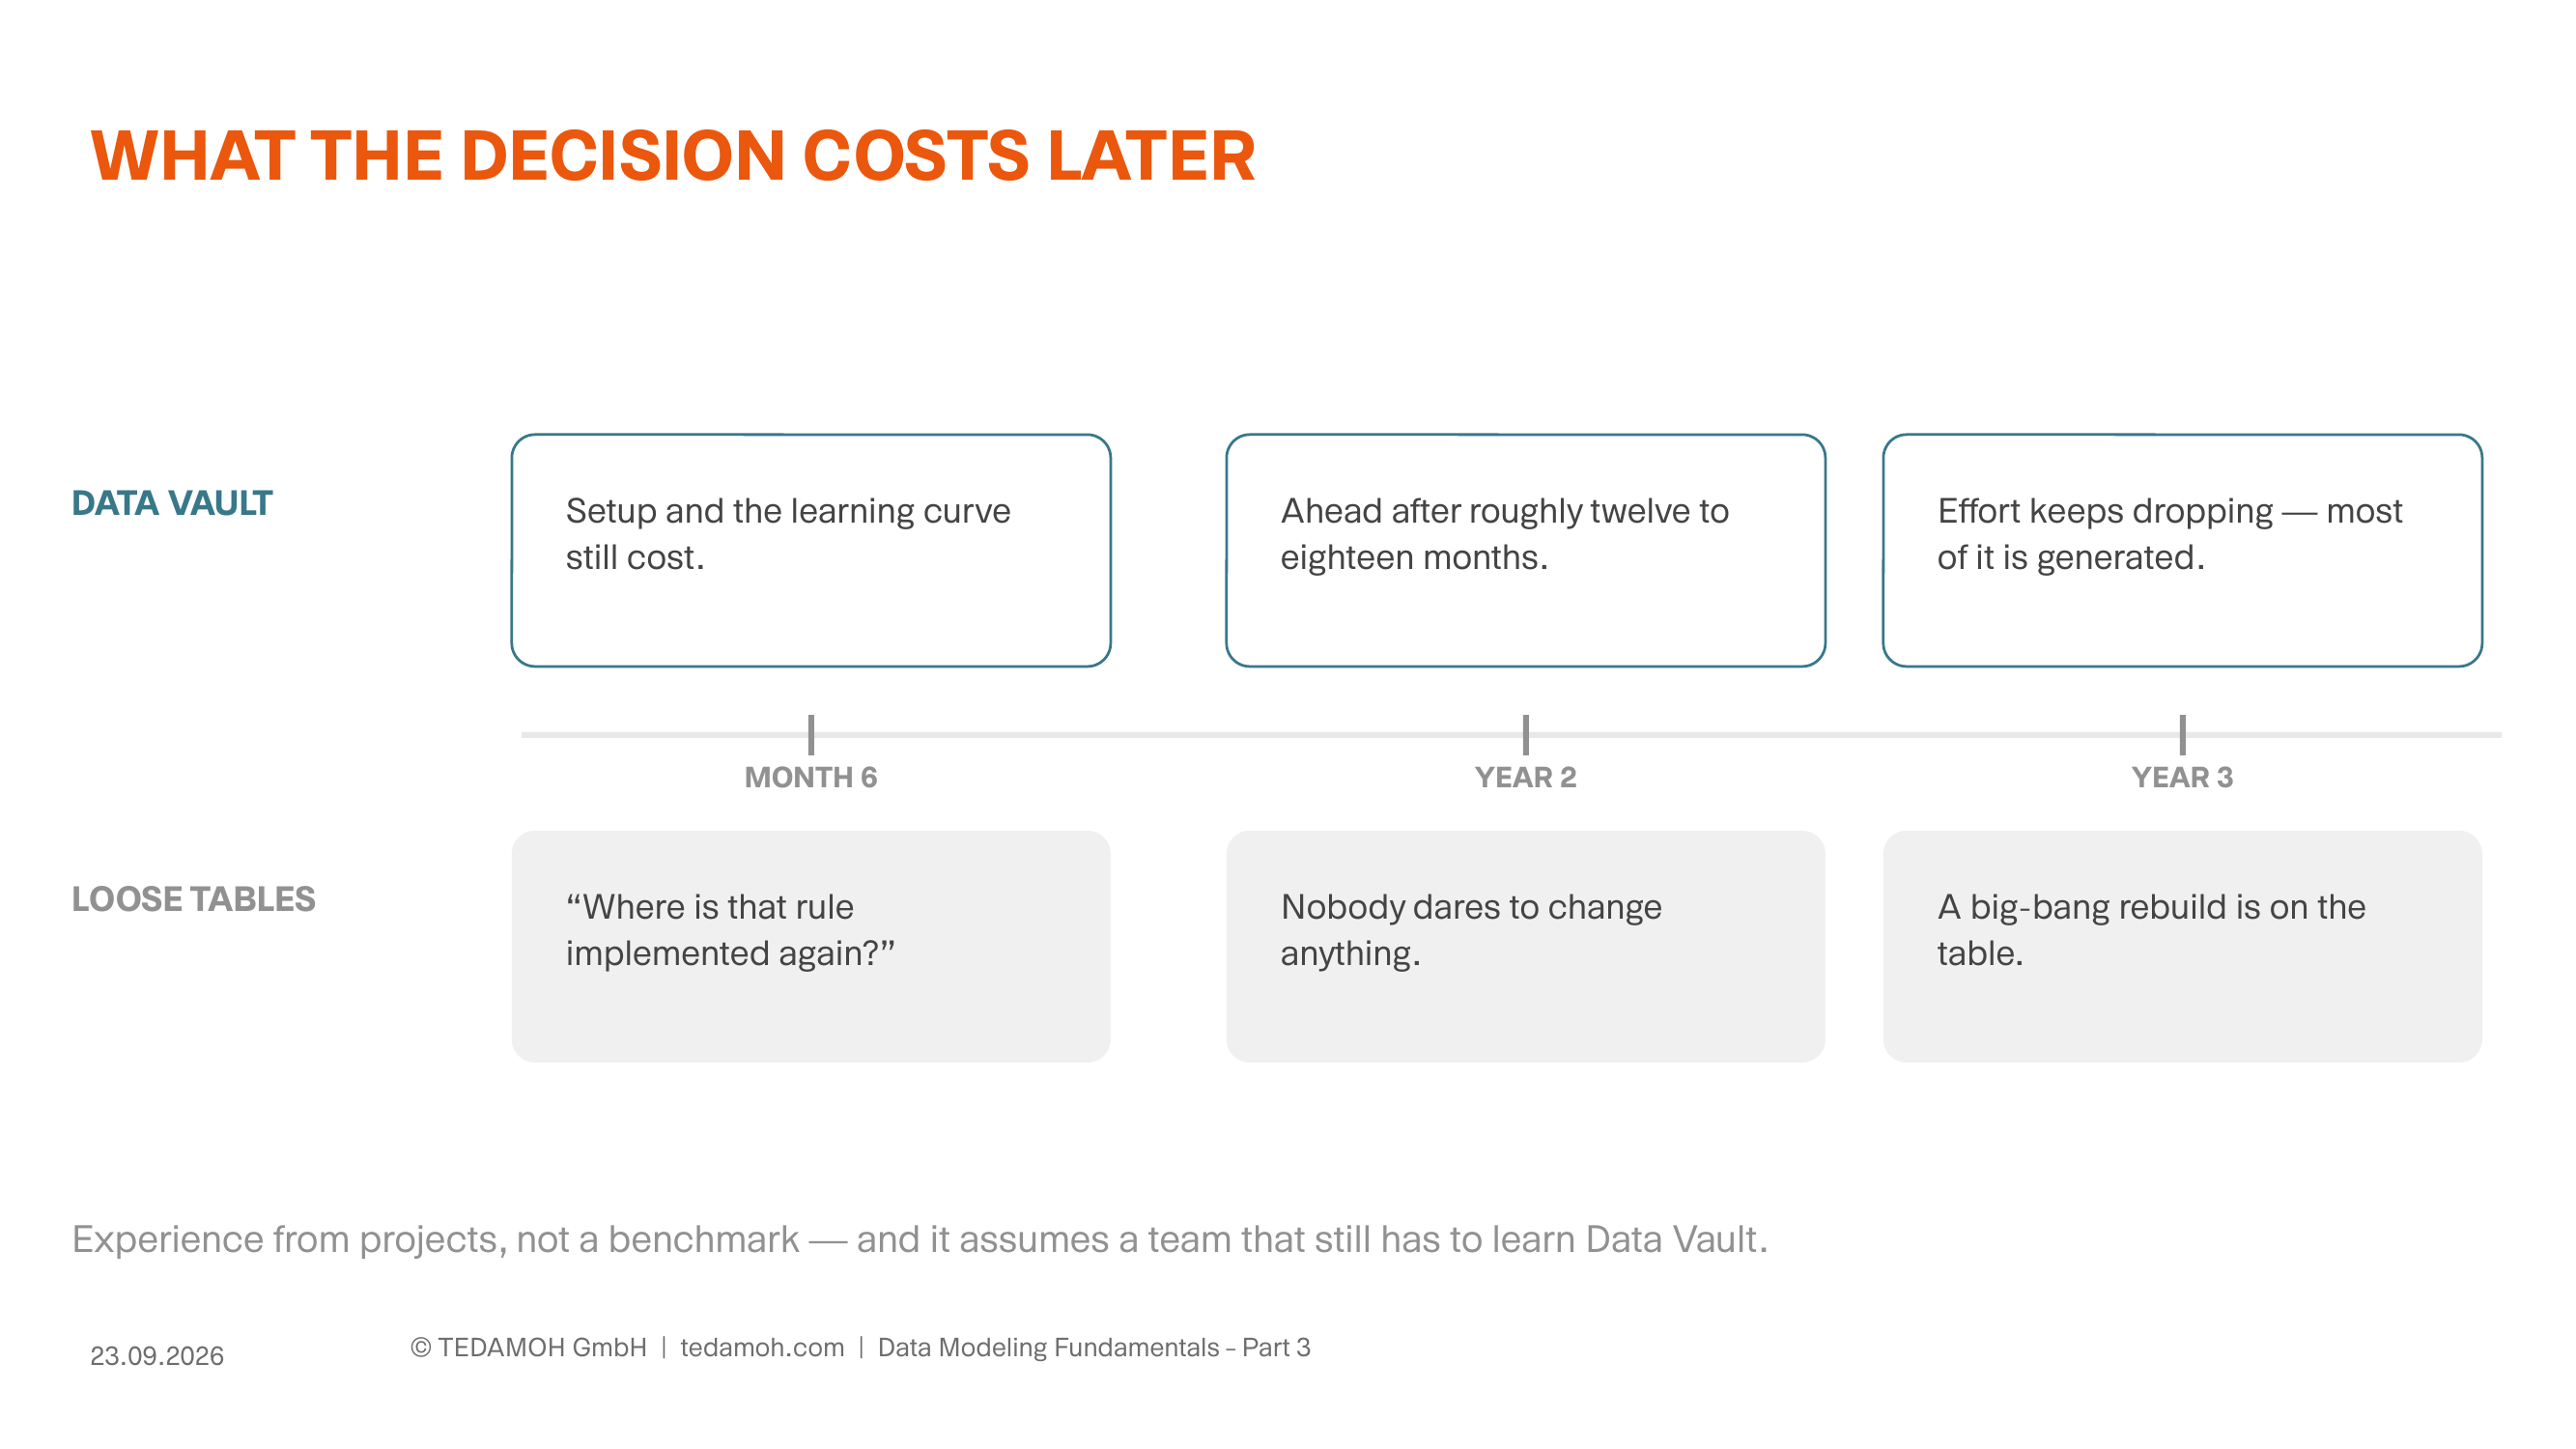
The decision is made in week one. You pay for it from month six.
What you do not see early on is the timing. In the first months the fastest option is always loose tables with a dashboard on top: the business is happy, and it looks good. Six months in, somebody starts asking where that one rule is actually implemented. Two years in, nobody dares to change anything, and onboarding a new colleague takes months. Data Vault runs the other way around. The learning curve and the setup cost you up front, after roughly twelve to eighteen months it is ahead, and from there the effort keeps dropping because most of it is generated. Those time frames are experience from projects, not a benchmark, and they assume a team with 3NF in the house that still has to learn Data Vault — bring that experience along and the point moves forward.
At FastChangeCo the first condition does not hold, and you can see it at a glance. The HR data does not come from one system but from the HR system, time management and the contract management for contractors — exactly the three sources the subtypes from part 2 feed on. Michael Mueller goes with the route through the integration layer and writes two sentences about why. Those two sentences are usually the only thing that still explains, three years on, why the system is built the way it is.
About this series: This is part 3 of 3 of "Data Modeling Fundamentals". The overview is in the hub article. Part 1 followed a single term through the three levels, part 2 showed on a single term how a conceptual model comes about.
Method decided, and nobody on the team has done it before?
That is where On Demand Coaching comes in: on your own model, with your own sources, in your own architecture — not on an example from a course.
What the method carries over, and what it adds
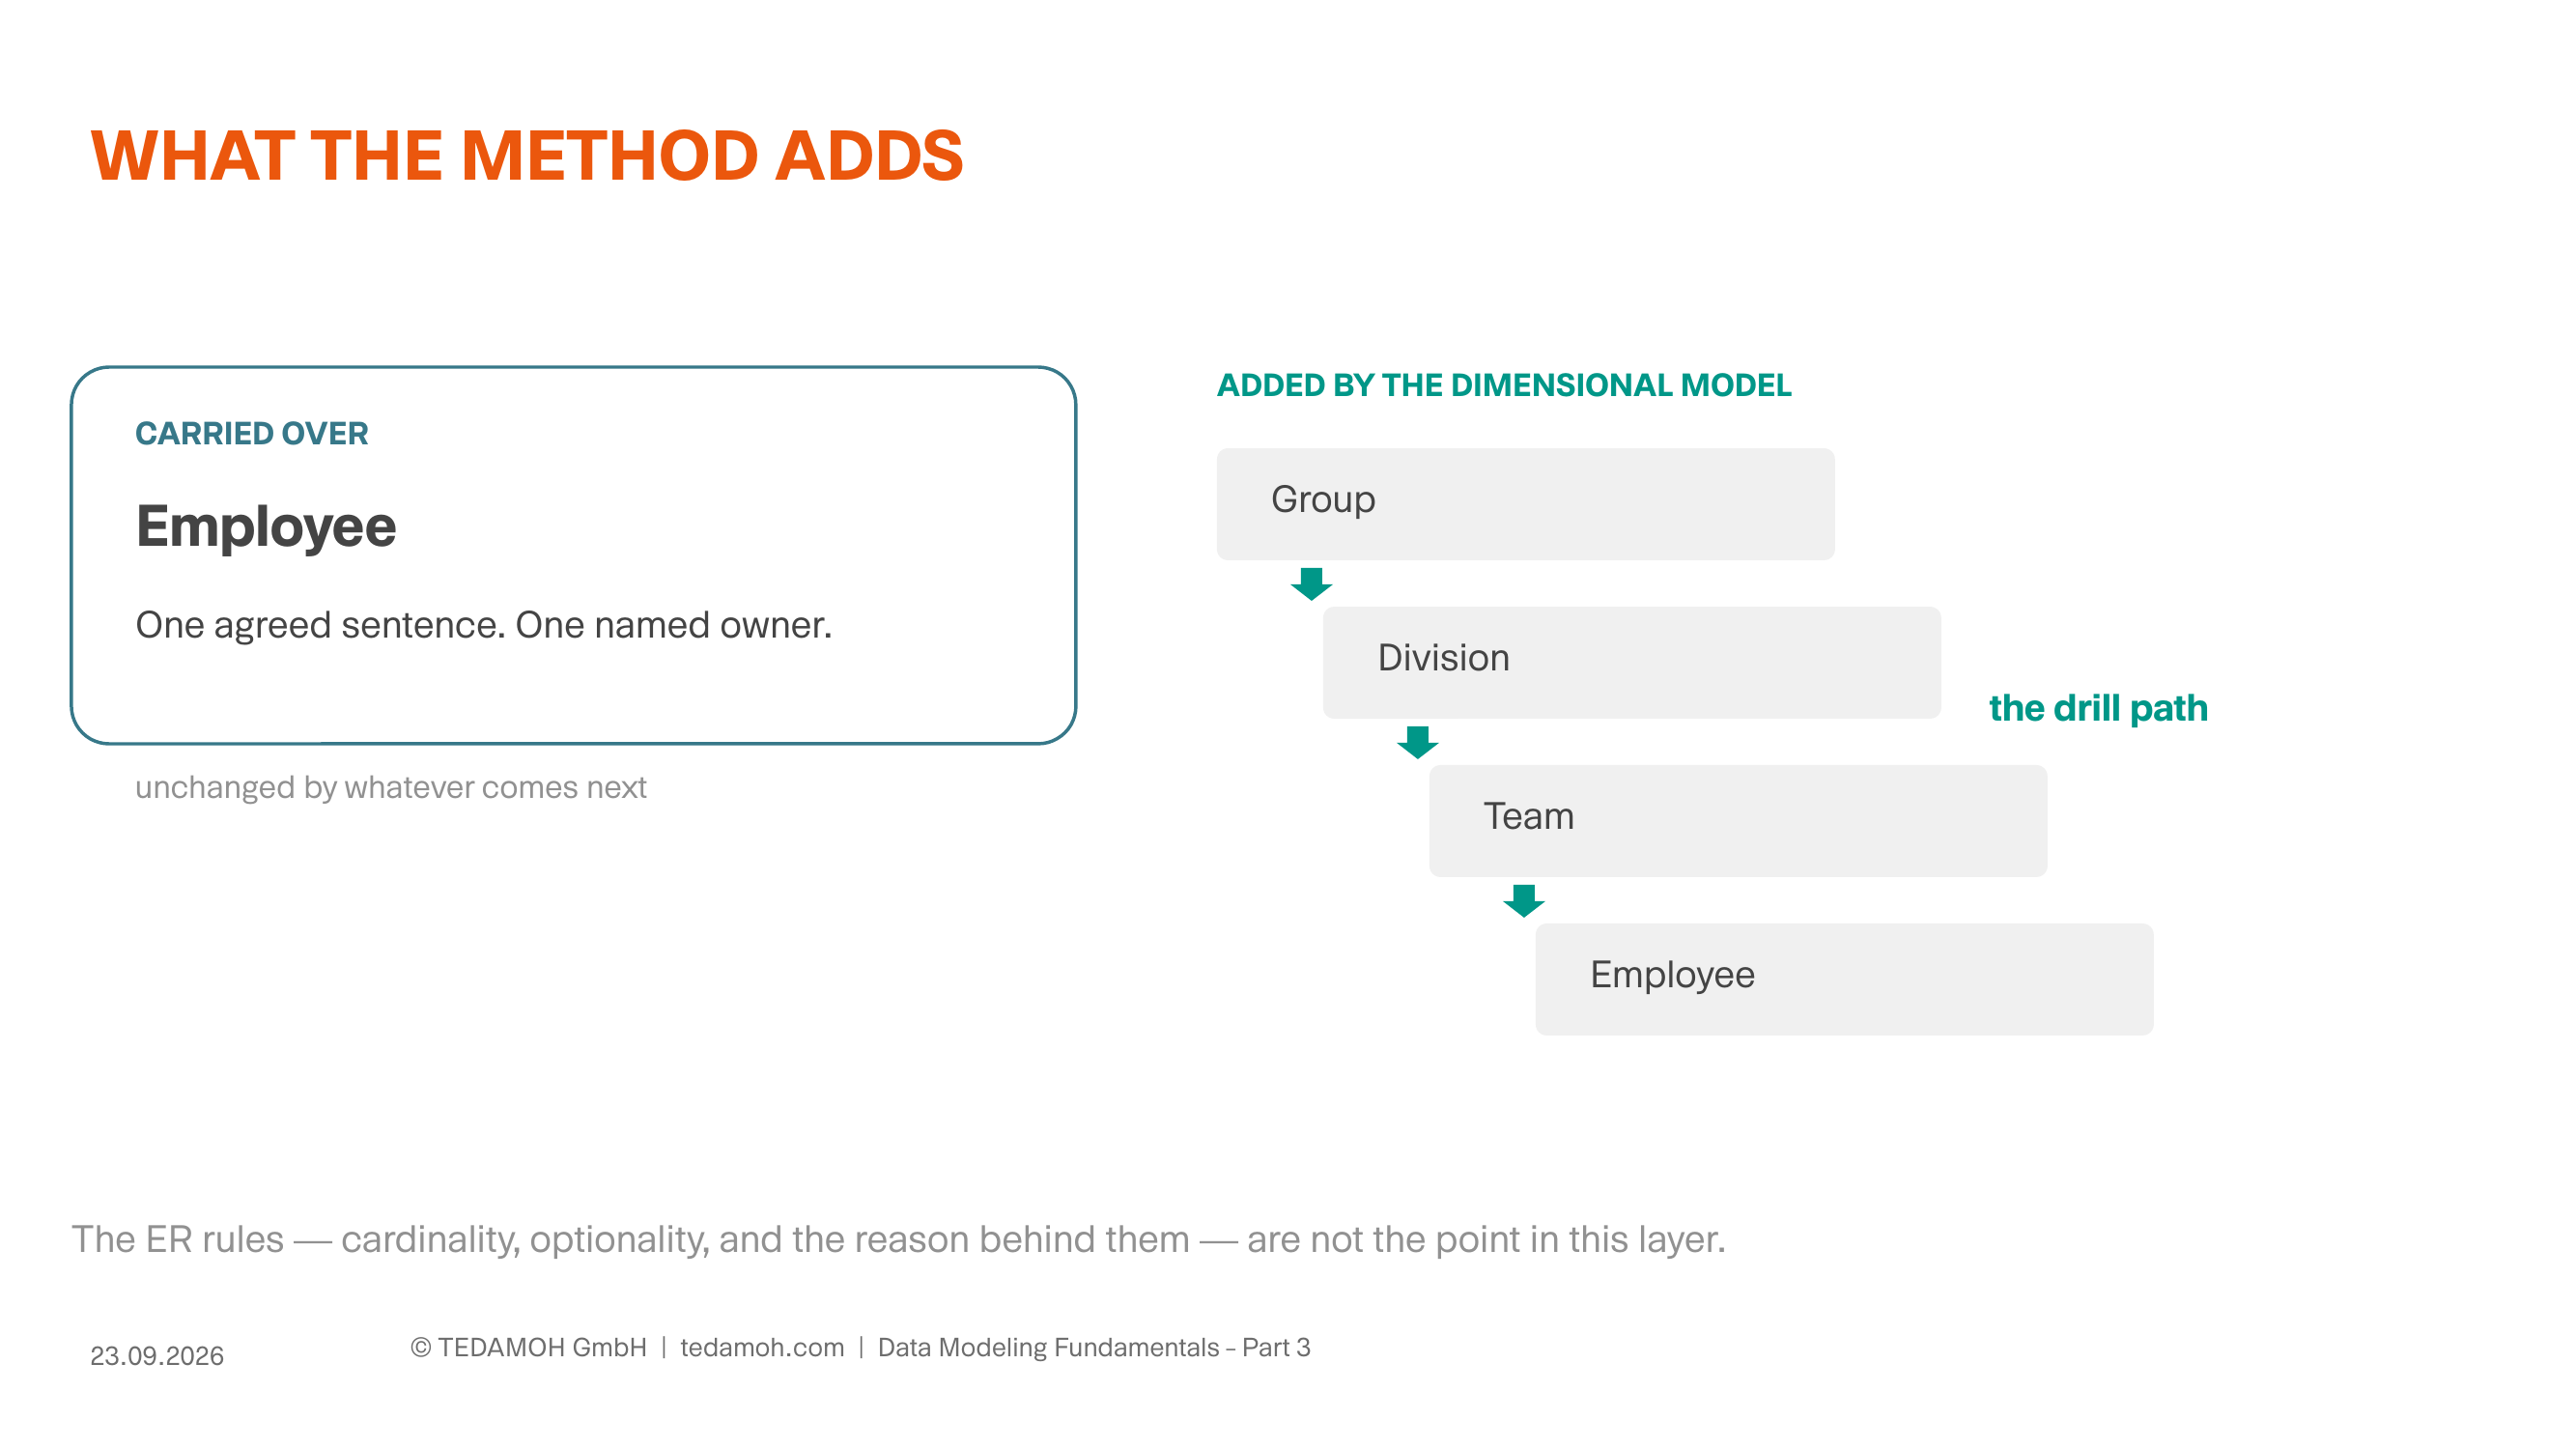
The definition travels along unchanged. What gets added are the paths people analyze along later.
However the decision goes, the definition from part 2 stays as it is. It does not change. A dimensional model carries over terms and definitions, and it adds things of its own that do not show up in the entity relationship model at all — hierarchies, and the paths you move along later in an analysis. The other way around, the rules from the ER model, cardinalities and optionalities together with the business reason behind them, are no longer the point in the access layer. By the way: whether a rule like that belongs in the model or is a business rule, I worked through on a 1:M link (in German) some time ago.
How you can tell whether it is any good
That leaves the question part 2 ended on: how do you tell whether any of it is worth anything? The hardest test is a single question, and I like asking it. Hand your model to someone outside the domain, or to an AI — do they come back with the same number as the business? If not, what you are missing is not the technology or another fancy add-on — what you are missing is the information model.
That is the counter-check on the number from part 2. Pass it, and you have not only negotiated the definitions but also written them down well enough for someone without the context to count with them.
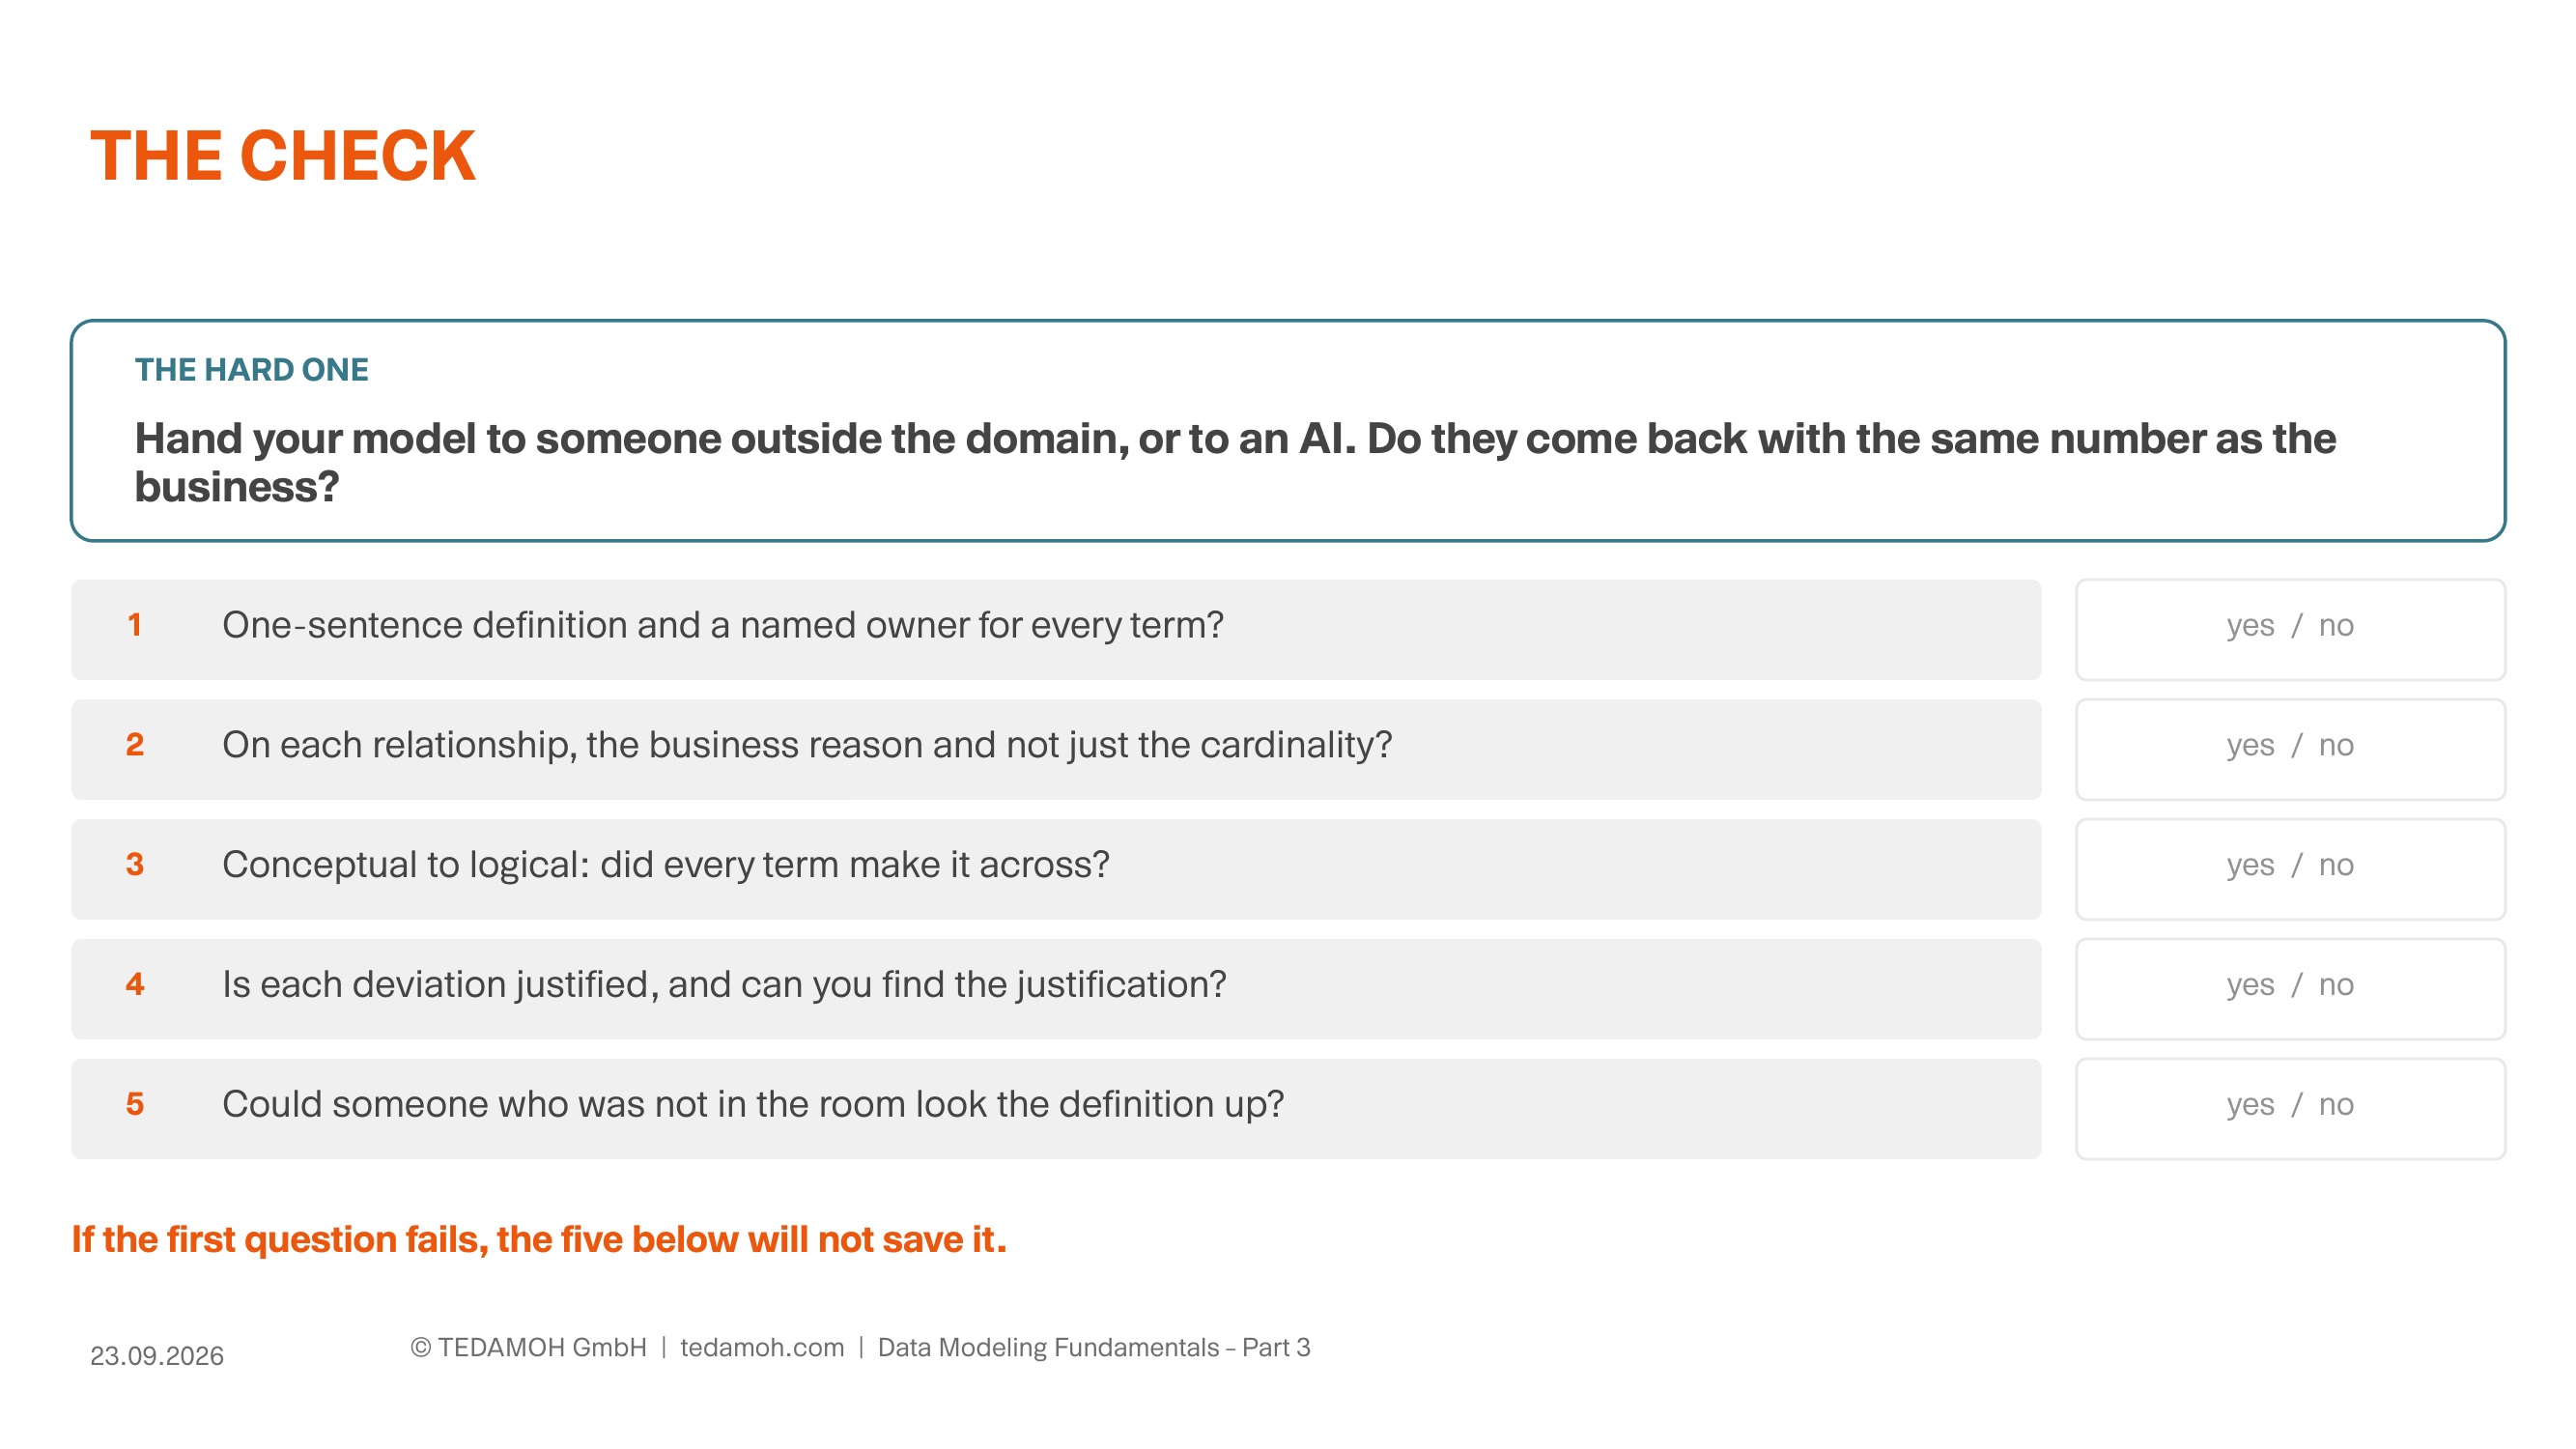
Five questions you can run against your own model in half an hour.
Five smaller checks follow from this series:
- Does every term have a one-sentence definition, and next to it the person who owns it?
- On the relationships: is the business reason there, or only the cardinality?
- Nothing may disappear between the conceptual and the logical level — every term has to be carried over.
- On implementation: every deviation from the obvious route is justified, and the justification sits somewhere you will find it again.
- And last: can somebody who was not in the room get to the definition?
The grown-up version of this check is the Data Model Scorecard® with its ten categories, from correctness through abstraction to definitions. Why I work with it (in German) I have written up elsewhere. To get started, the five above will do.
That closes the series. The fourth quarter is about data products — and they assume exactly what these three parts have built: a term people have agreed on, and a model you can find it in.
So long,
Dirk
Sources
The layer structure and the decision paths per layer come from the reference architecture Roelant Vos and I describe in Data Engine Thinking. The time frames given are experience from projects.
The Data Model Scorecard® is Steve Hoberman's, Technics Publications, 2015.
The desert and tribes analogy is Bill Reynolds', from this post of September 2026, used with his permission.
FastChangeCo is a fictional company; the scenes in the example are invented.